Thursday, August 27, 2009

OpenX API bindings for .Net

I've been working for the last month on a library that implements API bindings for OpenX in .Net. The OpenX API is quite big and I recently finished mapping all available methods so I decided to call it an early alpha release.

With this you can do:

  • CRUD operations on all OpenX entities (Advertiser, Banner, Campaign, Manager, Publisher, User, Zone)
  • Configure banner targeting
  • Link/unlink zones with banners and campaigns
  • Get various stats with strongly typed results

It relies on Charles Cook's XML-RPC.NET library (which is the de-facto standard xml-rpc library for .Net) which I had to modify slightly due to some irregularities in the OpenX XML-RPC server. Hopefully Charles will make xml-rpc.net more tolerant to these glitches soon so I can kill off my fork and use the standard xml-rpc.net.

Anyway here's a sample snippet querying for an advertiser's daily stats:

[Test]
public void AdvertiserDailyStats() {
    using (ISession session = new SessionImpl("user", "password", "http://localhost:10002/openx/api/v2/xmlrpc/")) {
        DailyStats[] r = session.GetAdvertiserDailyStatistics(1, DateTime.Now.AddYears(-1), DateTime.Now);
        Console.WriteLine("got {0} stats", r.Length);
        foreach (DailyStats stat in r) {
            Console.WriteLine("Stats for day {0}:", stat.Day.ToShortDateString());
            Console.WriteLine("Impressions: {0}", stat.Impressions);
            Console.WriteLine("Clicks: {0}", stat.Clicks);
            Console.WriteLine("Requests: {0}", stat.Requests);
            Console.WriteLine("Revenue: {0}", ((decimal) stat.Revenue).ToString("C"));
        }
    }
}

I wanted to release this as as early as possible because it's feature-complete but barely tested so I need people to try it and help me stabilize it by reporting any bugs and hopefully also contribute patches!

You can browse the code and fork it on github.

Binaries are available here.

PS: It seems that both Roger Dickey and I have been working independently on this at the same time, a situation that always sucks. I pinged him when I discovered this and he agreed to work together with me on this one.

Thursday, August 20, 2009

Poor man's profiler with Windsor

I generally advise to keep the IoC container out of the tests, but sometimes it is a convenient tool to have. Take for example the auto-mocking container concept. It's just too useful so I make an exception to the previous rule sometimes.

Here's another use for a container in a test: a profiler. All IoC containers have some proxying abilities (or rather, they delegate to one of the proxying libraries), which can be leveraged to build a basic profiler. A profiler is especially useful in integration tests where there's something that's taking too much time but you can't put your finger on the culprit simply because there are too many components involved.

A real-world example: an application which uses SolrNet was taking too long when getting lots of documents from Solr. There was nothing weird in Solr's log so it was a client issue. Let's profile it!

Setting up the profiler

We create a ProfilingContainer and add all the components we want to profile:

IWindsorContainer container = new ProfilingContainer(); 
container.AddComponent<ISolrDocumentResponseParser<Document>, SolrDocumentResponseParser<Document>>(); 
container.AddComponent<ISolrResponseParser<Document>, ResultsResponseParser<Document>>("resultsParser"); 
container.AddComponent<IReadOnlyMappingManager, AttributesMappingManager>(); 
container.Register(Component.For<ISolrQueryResultParser<Document>>().ImplementedBy<SolrQueryResultParser<Document>>() 
    .ServiceOverrides(ServiceOverride.ForKey("parsers").Eq(new[] { "resultsParser" }))); 
container.AddComponent<ISolrFieldParser, DefaultFieldParser>(); 
container.AddComponent<ISolrDocumentPropertyVisitor, DefaultDocumentVisitor>();

Adding code to profile

We add the code that exercises the components:

var parser = container.Resolve<ISolrQueryResultParser<Document>>(); 

for (int i = 0; i < 1000; i++) { 
    parser.Parse(responseXMLWithArrays); 
} 

Getting the actual profile data

Finally, we get the profile data:

Node<KeyValuePair<MethodInfo, TimeSpan>> rawProfile = container.GetProfile();

This returns a tree of method calls, each with its logged duration. We just want a list of aggregated durations, so first we flatten the tree:

IEnumerable<KeyValuePair<MethodInfo, TimeSpan>> profile = Flatten(rawProfile);

And now we can query and write the profile:

var q = from n in profile 
        group n.Value by n.Key into x 
        let kv = new { method = x.Key, count = x.Count(), total = x.Sum(t => t.TotalMilliseconds)} 
        orderby kv.total descending 
        select kv; 

foreach (var i in q) 
    Console.WriteLine("{0} {1}: {2} executions, {3}ms", i.method.DeclaringType, i.method, i.count, i.total); 

Which prints something like this (prettified):

Method Executions Total own time
AttributesMappingManager.GetFields(Type) 21000 2803.23ms
DefaultDocumentVisitor.Visit(Object, String, XmlNode) 10000 432.19ms
DefaultFieldParser.Parse(XmlNode, Type) 10000 122.77ms
SolrQueryResultParser<Document>.Parse(String) 1000 93.52ms
DefaultFieldParser.CanHandleType(Type) 10000 44.71ms
SolrDocumentResponseParser<Document>.ParseResults(XmlNode) 1000 43.11ms
ResultsResponseParser<Document>.Parse(XmlDocument, SolrQueryResults<Document>) 1000 30.28ms
DefaultFieldParser.CanHandleSolrType(String) 10000 23.78ms


Analyzing the profile

Well, it's obvious that AttributesMappingManager.GetFields() is to be blamed here, it's taking a lot of time... which is only logical since it uses a lot of reflection...
But wait a minute, I already thought about that when I wrote that MemoizingMappingManager (which is a memoizer decorator for the AttributesMappingManager)... only I forgot to add it to the container!

Fixing and re-running the profile

After adding the MemoizingMappingManager, the profile comes out like this:

Method Executions Total own time
DefaultDocumentVisitor.Visit(Object, String, XmlNode) 10000 358.64ms
SolrQueryResultParser<Document>.Parse(String) 1000 166.64ms
DefaultFieldParser.Parse(XmlNode, Type) 10000 87.13ms
MemoizingMappingManager.GetFields(Type) 21000 50.5ms
DefaultFieldParser.CanHandleType(Type) 10000 42.03ms
SolrDocumentResponseParser<Document>.ParseResults(XmlNode) 1000 34.93ms
ResultsResponseParser<Document>.Parse(XmlDocument, SolrQueryResults<Document>) 1000 30.83ms
DefaultFieldParser.CanHandleSolrType(String) 10000 22.22ms
AttributesMappingManager.GetFields(Type) 1 19.82ms


Conclusion

This cheap profiler has a number of caveats:

  • Since it works by adding a DynamicProxy interceptor to everything, it can only profile interceptable classes and methods managed by Windsor.
  • Times should be taken with a grain of salt. Based on a couple of unscientific tests, it can introduce an error of 10ms (on my machine), rendering a 10ms measured time useless. I'd only use these times for a qualitative comparison. There's a reason why there's a specific .Net profiling API.
  • Multithreading: each thread will get its own interceptor, so each thread gets its own profile.
  • What I just described is not really a test. There is nothing asserted, it can't pass or fail. The "test" here is just a means to run the profile. It should be [Ignore]d.

All in all, I found this to be quite useful. ProfilingContainer is just a thin wrapper around WindsorContainer that adds a ProfilerFacility, which in turn sets up a ProfilingInterceptor. So you could, for example, add the ProfilingInterceptor to your application container with a per-web-request lifestyle and code a HttpModule to profile an entire http request.

Code is here. Sample profile shown in this post is here.

Sunday, July 19, 2009

The current status of Git on Windows

So I finally hopped on the Git wagon, and I gotta say it's awesome! It takes some learning, but once you grok it, it's quite a simple model really.

I'm currently using Git via git-svn at work at the moment since I don't want to disturb the rest of the team just yet. Git-svn allows me to take most of the advantages of DVCS and when I'm done I commit to svn to publish my changes. Well, I'm not going to do a tutorial here, you can easily find lots of them on the net. I'll just say that if you're considering using a DVCS, go for it. Don't listen to those who say it's more complex or it has many more commands. Just go for it, it takes some learning but it's totally worth it. But please, do it with an open-minded approach. It's a different paradigm, try not to judge it from centralized version control concepts.

In my opinion, within three years from now almost everyone will be using a DVCS. Even the svn team is considering implementing an "hybrid distributed/centralized model" so if you stick with svn you'll probably use decentralized features in a couple of years.

The adoption rate of DVCS is pretty fast. Take a look at these graphs of Git Survey 2008 responses, and GitHub traffic:

 git_survey_responses (1)


And that's just Git. Mercurial and Bazaar usage are growing too.

However, it isn't all roses with Git on Windows. Linux people are used to the command line so it's not much of a problem for them to use the git CLI, but we Windows users are too spoiled by the ubiquitous GUI, and the excellent TortoiseSVN, AnkhSVN and VisualSVN. I think I never had to drop down to the command line to do something in svn. Even when I had to script something that involved svn, I just used SharpSvn and Boo.

With Git, I'm currently using the following mix of interfaces:

  • gitk for history browsing and deleting branches.
  • git-gui or TortoiseGit for committing.
  • TortoiseGit for rebasing and conflict resolution.
  • git-gui for merging, creating branches, pushing, fetching.
  • gitk or git-gui for checkout.
  • GitExtensions for single-file history within Visual Studio.
  • git bash (command line) for git-svn and sometimes pulling, fetching and merging.

There are even more GUIs, like git-cola, qgit and others. So the problem isn't really a lack of GUIs. The problem is that none of them gets everything right, like TortoiseSVN does. Or at least I haven't found one. So I have to keep switching between them, which obviously isn't optimal. Now I don't mean to bash them, to their credit, GUIs and Windows support have improved hugely in the last 12 months or so. In particular, TortoiseGit has gone from nil to very usable in about 6 months by taking advantage of the TortoiseSVN codebase.

Another issue is the speed. Everyone says git is fast. Not so much on Windows, because Windows doesn't have fork() so it has to be emulated (which is slow) and exec() is also much slower than Linux. Git-svn is particularly slow because of this.

Now I don't like to rant aimlessly. I think the way to truly address these issues is to first build a solid foundation, a solid git library for Windows. And that foundation is GitSharp, which is a port of the Java jgit. The port is currently only 50% complete so it needs as much help as possible. Are you interested? Fork away! ;-)

Friday, July 3, 2009

Redundancy + Dependency injection

= Reliability.

Today, one of the biggest payment gateways, Authorize.Net, went down because of a big power outage caused by a fire. Everyone is twittering like crazy, ranting and asking customers to order by phone.

Authorize.Net is also our payment gateway at work, but this wasn't a major issue for us. We just had to swap the payment processing implementation from Authorize.Net with the one that uses a Verisign Payflow Pro account, and that's it. We even didn't have to shut down the site because we have this set up via dynamic.web.config.

Really, you gotta love dependency injection in times like these!

Tuesday, June 9, 2009

Analyzing SolrNet with NDepend

I've been using NDepend off and on for the last couple of years. Mainly to diagnose build issues and help me write build scripts for complex legacy applications, since legacy applications with no automated build often fall into cyclic dependencies between different solutions. NDepend's assembly build order feature is great for this. But I've never had the time to really dive into the myriad other features this product offers.

A couple of weeks ago Patrick Smacchia kindly sent me a Pro license for NDepend (thanks Patrick!), so I thought it would be a great opportunity to use it to analyze SolrNet. Now, SolrNet is by all measures a tiny project (ohloh stats are inflated due to Sandcastle, SHFB, etc being in the trunk), but that doesn't mean it can't benefit from NDepend.

First of all, if you're analyzing a library, I recommend that you include your tests in the analysis, so that NDepend can see how the library is actually used. Otherwise, NDepend will suggest that you mark some things as private when it shouldn't. Don't worry about the tests raising warnings in the analysis, you can filter them out as I'll explain later. Plus, having the ability to analyze the tests can be pretty handy too.

For example, we can easily issue some CQL queries to get the code/test ratio:

SELECT ASSEMBLIES WHERE NameLike "Tests" 1972 LOC (as defined here)
SELECT ASSEMBLIES WHERE !NameLike "Tests" 1550 LOC

So the code:test ratio is 1:1.27, more LOC of tests than code! However, keep in mind that this metric alone doesn't imply a correct coverage.

Browsing the default queries, I find that "Fields that could be declared internal" caught a

public readonly string query;

Oops, fixing right away!

Under "Purity / Immutability / Side-Effects", "Fields should be marked as ReadOnly when possible" showed 29 results, which seemed strange since I always try to make my objects immutable. 24 of these were <>l__initialThreadId fields, which is one of the fields of the iterator that the C# compiler builds when you use yield return. This also happened with the "Methods too big", "Methods too complex" and "Potentially unused methods" metrics.

Of course, you can edit or delete the default CQL queries. For example, the "Potentially unused methods" is defined by default as:

// <Name>Potentially unused methods</Name>
WARN IF Count > 0 IN SELECT TOP 10 METHODS WHERE 
 MethodCa == 0 AND            // Ca=0 -> No Afferent Coupling -> The method is not used in the context of this application.
 !IsPublic AND                // Public methods might be used by client applications of your assemblies.
 !IsEntryPoint AND            // Main() method is not used by-design.
 !IsExplicitInterfaceImpl AND // The IL code never explicitely calls explicit interface methods implementation.
 !IsClassConstructor AND      // The IL code never explicitely calls class constructors.
 !IsFinalizer                 // The IL code never explicitely calls finalizers.

We can easily add another condition so that these methods don't bother us: AND !FullNameLike "__"

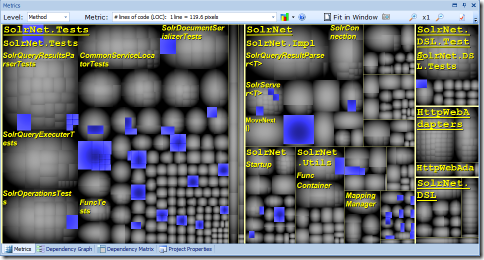
One of the most useful features of NDepend is comparing two versions of a project. I compared the latest release of SolrNet against trunk. Here's a chart of added methods (83 in total, in blue):

83 methods added

34 methods changed:

methods-changed

API breaking changes (no graphic here, just a list):

api-breaking-changes

Don't worry, these are all internal breaking changes, they won't affect the library consumer...

From these graphics you can immediately see that there aren't really many changes, and they aren't focused. The reason is that most of the changes are minor bugfixes and a couple of minor added features.

I only scratched the surface of what's possible with NDepend, but as you can see, small projects can also profit from it, so check it out!